| INSTITUTIONAL RESEARCH UPDATE ON NRC RANKINGS | ||||||||||
|
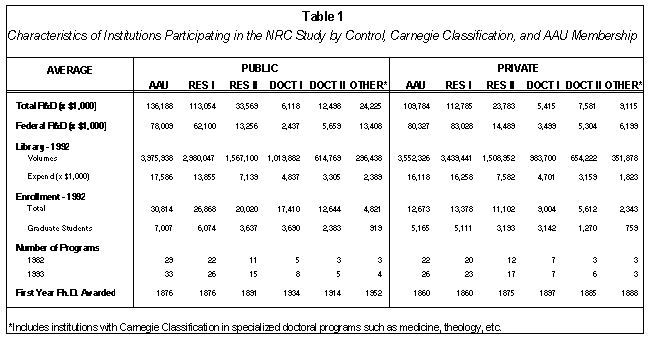
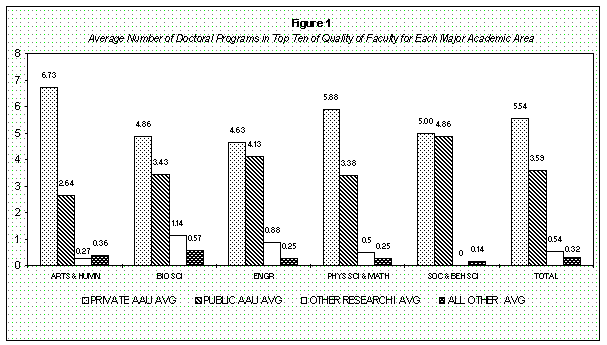
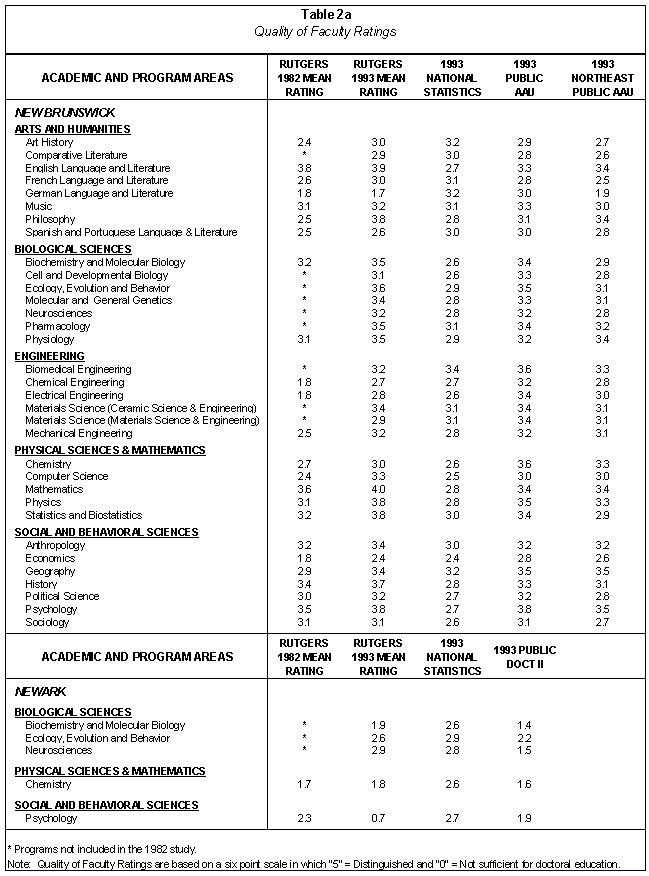
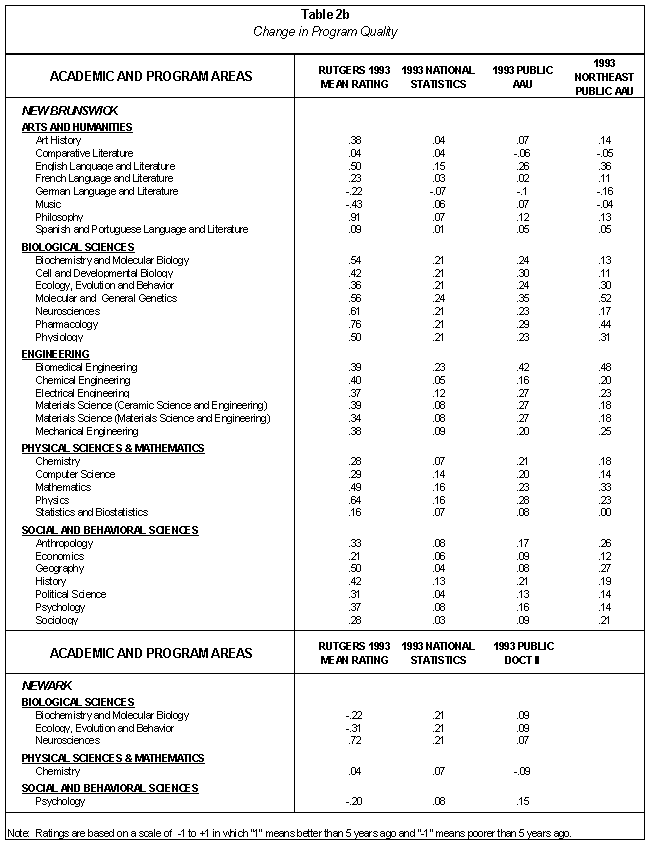
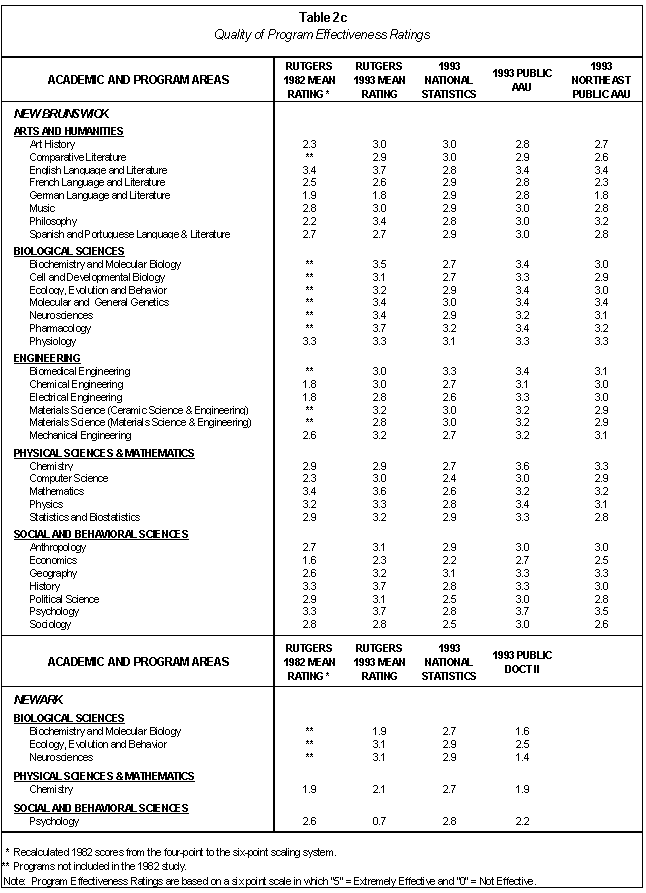
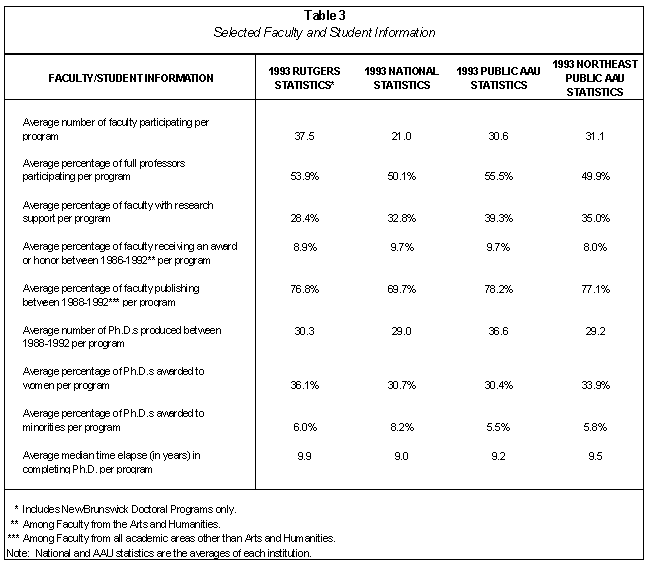
INTRODUCTION This report is intended to introduce the Rutgers Community to the recent National Research Council's (NRC) report on doctoral education in the United States. Particular attention will be given to: placing the NRC study in the context of earlier studies of doctoral education; briefly discussing how the NRC data were obtained, examined and presented; and outlining some of the ways the NRC data can be used to better understand doctoral education at Rutgers. In addition, some of the basic findings of the NRC report will be presented. Interest within and outside the academy in the quality of doctoral education in the United States has been heightened with the release last Fall of NRC's Research-Doctorate Programs in the United States: Continuity and Change. (1) This publication updates an earlier study by the Conference Board of Associated Research Councils (CBARC), An Assessment of Research-Doctorate Programs in the United States, which was published as a five-volume report in 1982. The NRC publication has received much attention in the media, with articles appearing in the Chronicle of Higher Education, Change magazine and the New York Times. Some reasons for interest in the NRC report include: its size - the NRC study surveyed 3,634 doctoral programs at 274 American universities in 41 different academic fields; its reputational rankings - subjective program and faculty quality assessments are provided by knowledgeable academics rather than magazine editors or media pundits; its wealth of data - both reputational and objective measures on doctoral programs, as well as institutional-level data, are included in this study; its consistency with the 1982 study - many of the measures used in the NRC report can be compared with results of the earlier CBARC study; its presentational structure - data for institutions and their respective programs were rank-ordered by various measures found in the report, thereby giving readers a quick comparative interpretation of the data; its accessibility - much of the data used in the NRC report are not only available in printable form, but can also be accessed electronically from NRC's World Wide Web site; and its potential for further analysis and research - researchers have the capability of further analyzing the data found in the NRC study beyond that undertaken by the authors of the report. BACKGROUND TO THE NRC STUDY The concern for assessing the quality of doctoral education in the United States has been long-standing. The first serious effort to assess doctoral programs in the United States was undertaken by Raymond Hughes in 1925. Hughes, the then president of the University of Miami at Ohio, conducted a survey of doctoral programs in twenty fields, representing thirty-eight of sixty-seven institutions that offered the Ph.D. at that time. Hughes compiled a list of well-noted scholars and asked each scholar to evaluate between twenty and sixty programs apiece in the scholar's respective academic field. Although the work of Hughes was well known within academia and did not go uncriticized,(2) it wasn't until the 1960s and especially the 1970s that studies designed to assess the quality of doctoral education in the United States expanded. Reviewers have categorized the many and varied studies that have sought to assess the quality of doctoral programs into three general types: reputational studies; objective indicator studies; and quantitative correlate studies.(3) Most of the well-known studies have been of the reputational type -- the subjective evaluation of doctoral programs by faculty and/or academic administrators (e.g., departmental heads and deans) to arrive at a rating for programs within an academic field. Although well-known, these studies have also received the most criticism. The essential argument against reputational studies has been that these inquiries are more an assessment of a program's faculty reputation rather than an indicator of a program's overall quality. One set of studies has sought to correct this limitation by assessing a program's quality through readily available objective indices of faculty research production. The rationale for this approach is that the quality of a department is necessarily dependent on the quality of its faculty. However, the problem with this position relates to the lack of consensus with how faculty quality can be measured. Such studies have relied, for the most part, on measures such as the number and type of publications and citations, but have also included non-faculty indices such as student outcomes and institutional or departmental financial resources. Another type of study, often called quantitative correlate studies, has aimed at understanding the components of doctoral program quality by seeking to determine those variables that are most strongly related to reputational information about a program. Using many of the measures found in objective indicator studies, correlate studies have the potential of contributing to institutional planning by identifying measures that underlie quality of different doctoral programs (e.g., faculty size, number of full-time professors, etc.).(4) Many criticisms, both methodological and conceptual, have been leveled against all three types of studies. In addition to the criticism that many of these studies, and especially reputational studies, tend to confuse the reputation of a doctoral program for quality, other criticisms that have been directed at studies of doctoral education include the existence of: rater bias; outdated data; unreliable and incorrect data; unidimensionality (i.e., the lack of including more than one indicator of quality); and an atheoretical focus (this latter criticism is often cited against correlate studies). Although these critiques tell us that we should be careful when interpreting the results of these studies, they also have contributed to an ongoing refinement of studies of this kind. The NRC study represents the most recent and perhaps the most comprehensive response to date to the shortcomings of the earlier studies. THE METHODOLOGY OF THE NRC STUDY Average characteristics of the institutions participating in the NRC report are found in Table 1. This table distinguishes among public and private institutions and various categories of the Carnegie classification system of higher education institutions.(5) Table 1 displays data derived from 105 private and 169 public institutions. Research I institutions comprise the category with the most schools (there are 90 Research I institutions accounting for 33% of all schools included in the NRC study). The main purpose of the NRC report was to present figures on individual programs in 41 academic fields. Academic fields included in the NRC report were based on three criteria: 1) the number of Ph.D.s produced nationally; 2) the number of programs training Ph.D.s within a particular field; and 3) the average number of Ph.D.s produced per program. Overall, 3,634 research-doctorate programs at 274 universities were included in the 1993 study. Two types of measures were collected for this study: reputational measures and data from secondary sources. Reputational measures were obtained for each institutional program based on the ratings given by faculty within a particular field. For each program, ratings of quality (of the faculty), effectiveness (of educating scholars), and the perceived change in quality (over the last five years) were obtained. Each faculty member who was included in the study was asked to rate approximately 50 programs in his or her field. For each institution, raters were given a faculty listing to be used as a reference. Approximately 100 ratings per program were obtained and the mean of these ratings was used to obtain an overall score for each program.(6) The data from secondary sources include information from four categories: faculty (e.g., total number of faculty in program, % of faculty publishing between 1988 and 1992); students (e.g., % of female students); doctoral recipients (e.g., % of doctoral recipients with research or teaching assistantships as a primary source of support, median number of years to complete Ph.D.); and institution (e.g., year of first Ph.D., average research expenditure). One of the features of the NRC report that makes it so impressive is its spanning of the three categories of studies mentioned above. Not only are reputational and objective measures of doctoral programs presented, additional analysis and discussion are also provided with regard to the relationship between the reputational measures used in the study and some of the secondary indices compiled for individual doctoral programs. The NRC report also presents some findings comparing institutions with regard to certain measures of change obtained from the 1982 CBARC and 1993 NRC studies (e.g., the change in the "Scholarly Quality of Program Faculty") and closer examination of the items that profile graduates of the various doctoral programs included in the report. IMPORTANCE OF THE NRC RANKINGS TO RUTGERS NRC data can be useful to faculty and staff at Rutgers because they place our doctoral programs in a multi-dimensional comparative context. First, these data provide longitudinal information. For example, the designers of the NRC study insisted on the comparability of as many measures as possible between the 1982 CBARC and 1993 NRC reports. Thus it is possible to see how a particular program has fared during the period between the administration of the two studies. Although not an overt longitudinal measure, the reputational measure, "Change in Program Quality in Last Five Years," provides additional insight with regard to program status over the recent past in the eyes of peer faculty. Second, these data allow us to compare Rutgers' program characteristics to those of similar programs offered by other universities. These comparisons can be made against national averages or they can be made against specific subgroups of universities. The importance of such peer comparisons cannot be over stated. Institutions of higher education vary by size, type of control, educational mission and other characteristics (e.g., regional distinctions and physical location) that often make comparisons among the different groupings of institutions senseless and, at times, misleading.(7) Even among members of the Association of American Universities (AAU), of which Rutgers is a member, a further distinction needs to be made between private and public AAU schools when deciphering the data in the NRC report. For example, Figure 1 shows that private AAU institutions consistently have more programs listed in the top ten of the "Scholarly Quality of Program Faculty" measure, on average, than public AAU institutions. Although the extent of the difference between these averages varies by academic area, it is clear from Figure 1 that doctoral programs from private AAU institutions are rated as having a higher quality of faculty than public AAU institutions. Some would interpret the data in Figure 1 to be an indication of the superiority of private AAU institutions in the administration of doctoral programs, while others would argue that these rankings instead show the biased nature of such reputational rankings.(8) However, an equally valid interpretation would acknowledge the success of doctoral education among the private AAU institutions while recognizing the confluence of historical and financial factors that make private AAU institutions different from all other institutions of higher education, including public AAU schools. Third, these data allow us to analyze Rutgers' academic achievement at a variety of levels. For example, academic success can be evaluated for specific programs (e.g., Psychology, Aerospace Engineering) and academic areas (e.g., Arts and Humanities, Biological Sciences). In addition, overall numbers for Rutgers (across academic areas) can be derived and assessed. SELECTED FINDINGS Quality of Faculty Ratings (Table 2a) Comparison Between Rutgers' 1982 and 1993 Ratings Quality of faculty ratings increased for most Rutgers' doctoral programs between 1982 and 1993 for which there are comparable data. The most notable increases occurred in Philosophy (from a mean rating of 2.5 on a six-point scale in 1982 to 3.8 in 1993), Chemical Engineering (1.8 to 2.7), Electrical Engineering (1.8 to 2.8), and Computer Science (2.4 to 3.3).(9) Comparison of Rutgers' 1993 Ratings with National and Peer Statistics In general, Rutgers' quality of faculty ratings are comparable to or higher than the national average. The following Rutgers' doctoral programs received ratings substantially above the national average: English (mean rating of 3.9 for Rutgers vs. the national average of 2.7), Philosophy (3.8 vs. 2.8), Biochemistry and Molecular Biology (3.5 vs. 2.6), Mathematics (4.0 vs. 2.8), Physics (3.8 vs. 2.8), History (3.7 vs. 2.8) and Psychology (3.8 vs. 2.7). In general, Rutgers received quality of faculty ratings which are comparable to that of the public AAU averages, and the public AAU schools scored consistently higher than the national average. Moreover, Rutgers does very well when compared to the average scores for public AAU institutions from the Northeast region.(10) Change in Program Quality (Table 2b) Consistent with the findings discussed above, the quality of the faculty in almost all Rutgers' programs is considered to have significantly improved during the five years prior to 1993. On a scale from -1.0 to +1.0, where 0 represents no change, almost all Rutgers' programs received positive ratings between .23 and .64. In comparison, the national average positive ratings for programs on this measure generally range from about .01 to .24. Rutgers also scores favorably well when national and Northeast public AAU institutions are considered. Average positive ratings for the various doctoral programs among national public AAU schools range from .02 to .42, among the Northeast public AAU schools these scores range from 0.0 to .52. Program Effectiveness Ratings (Table 2c) Comparison Between Rutgers' 1982 and 1993 Ratings Program effectiveness ratings increased for many Rutgers' programs between 1982 and 1993 for which there are comparable data. These increases ranged from .1 in Physics and French Languages and Literature to 1.2 in Philosophy and Chemical Engineering. Comparison of Rutgers' 1993 Ratings with National and Peer Statistics In general, Rutgers' program effectiveness ratings are comparable to or higher than the national average. The following Rutgers' programs received ratings substantially above the national average: English (mean rating of 3.7 for Rutgers vs. the national average of 2.8), Mathematics (3.6 vs. 2.6), History (3.7 vs. 2.8) and Psychology (3.7 vs. 2.8). In general, Rutgers received program effectiveness ratings which are comparable to those of national public AAUs and exceeded those of the Northeast public AAUs. Faculty and Student Information (Table 3) Rutgers' faculty and student statistics are similar to both public AAU and the national average on a number of measures. For example, the range for the percentage of full professors among various university groupings listed in Table 3 is between 49.9% and 55.5%, with 53.9% of Rutgers' full professors participating in doctoral programs. All four categories of institutions in Table 3 also have an approximate percentage of faculty members who received an honor or award between 1986 and 1992 (these values range from 8% for public AAU schools in the Northeast to 9.7% for national and public AAU schools). Furthermore, on average, each Rutgers' program produced approximately 30 Ph.D.s between 1988 and 1992, compared to 29 on the national level and among Northeast public AAU schools. Public AAU schools averaged a slightly higher number of Ph.D.s per program during this period (36.6). On average, it took slightly under ten years (9.9) for students to complete their Ph.D. at Rutgers; this average compares to 9, 9.5 and 9.2 for national, Northeast public AAU and national public AAU schools, respectively. Rutgers is somewhat different than the national average on three other measures. First, given Rutgers' size, it should be no surprise that the average number of faculty participating per program at Rutgers (37.5) is significantly greater than the national average (21.0) and somewhat greater than the public AAU (30.6) average. Second, the percentage of program faculty at Rutgers publishing between 1988 and 1992 (76.8%) was somewhat greater than the national average (69.7%) and on par with the public AAU average (78.2%). The percentage of Ph.D.s awarded to women is higher at Rutgers (36.1%) than the national (30.7%) or public AAU average (30.4%). Finally, Rutgers also has a higher percentage of Ph.D.s awarded to minorities when compared to all public AAU and Northeast public AAU institutions (6% compared to 5.5% and 5.8%, respectively). PARTIAL BIBLIOGRAPHY | ||||||||||
|
Clark, M.J., R.T. Hartnett, and L.L. Baird
Conrad, C.F. and R.T. Blackburn
Ehrenberg, R.G. and P.J. Hurst
Goldberger, M.L., B.A. Maher, and P.E. Flattau
Graham, A.G., R.W. Lyman, and M. Trow
Jones, L.V., G. Lindzey, and P.E. Coggeshall
Magner, D.K.
Tan, D.L.
Webster, D.S. and T. Skinner | ||||||||||
|
ENDNOTES 1 While the NRC survey was only released last September, the report is based on survey data collected during 1993 and secondary data from 1986 through 1992. 2 Two frequently mentioned criticisms of Hughes' work were that the size of his panel of experts for rating a given program was too small and that there was a geographical imbalance among the scholars evaluating the programs, with most of the raters residing in the Northeast and Midwest. 3 Conrad and Blackburn (1985) and Tan (1986). 4 Ehrenberg and Hurst (1996) is a recent example of how the combination of reputational measures and objective indicators may be used to inform institutional planning. 5 All American colleges and universities that are degree-granting and accredited by an agency recognized by the U.S. Department of Education are included in the Carnegie classification system. There are twenty classification categories in the Carnegie system, with the bulk of doctoral degrees coming from four categories. These include Research I, Research II, Doctoral I and Doctoral II institutions. For a full description of the various Carnegie classifications, see The Chronicle of Higher Education, April 6, 1994. For a complete listing of AAU institutions, both public and private, see the 1995-1996 Rutgers Fact Book, p. 107. 6 More specifically, these averages do not include the two highest and lowest scores in the computation of the mean. 7 One misleading effect of comparing institutions of differing sizes, types and/or mission is what the authors of one report (Graham, A.G., R.W. Lyman, and M. Trow, 1995) have called epistemic drift -- the tendency for institutions to respond to external accountability requirements and reports in a manner that may be contrary to their own interests. For example, an institution with a few doctoral programs but a strong undergraduate program may seek to aspire to the rating levels that major private universities often achieve in reports such as the NRC study by re-allocating its energies and resources from the area that is its strength (i.e., undergraduate instruction). The likelihood that such an institution will achieve significantly better ratings for its few doctoral programs is low, given that it probably lacks the institutional resources needed for such improvement, while at the same time weakening the area where it is quite successful. 8 This is akin to the "halo" effect argument that sees reputational rankings contributing to a pecking order among institutions such that evaluations of a specific program are inextricably connected to the institution's overall reputation. As Tan has noted (1986, p. 231), some critics see this as possibly contributing to an institution's lack of innovation due to the belief that such embracing of change imperils that institution's reputational ranking. In certain ways, this is the opposite of the tendency toward epistemic drift noted above. 9 Although this comparison of reputational scores between the 1982 and 1993 reports indicate that many Rutgers' doctoral programs experienced gains in their ratings, it is not entirely clear if these increases are the result of "real" improvement or "grade" (i.e., rating) inflation (i.e., that the 1993 raters were more lenient in their evaluation of programs). One indication that these increases are, in fact, reflective of improvement in doctoral education at Rutgers is the positive scores for Rutgers found in the "Change in Program Quality" reputational measure that is discussed shortly. For a discussion of score changes and the existence of grade inflation, see Appendix R in the NRC report. 10 In addition to Rutgers, these Northeast public AAU institutions include Maryland, Penn State, SUNY at Buffalo and Pittsburgh. |
||||||||||